Feel overwhelmed by everything you see in the Scheduling Window?
Written by Greg Miller
Get to know the Throughput Window and build efficiency into your production scheduling process.
Users who are new to VISUAL’s scheduling toolset are both intrigued and overwhelmed by VISUAL’s Scheduling Window presentation. Although the Scheduling Window does provide valuable at-a-glance information relative to lateness, scheduling gaps and overall resource backlog, successful VISUAL scheduling professionals have found VISUAL’s Throughput Window to be the hub for high-level and detailed schedule analysis.
The Throughput Window provides the following quantitative measurement tools:
- Customer Service Impact- A metric which quantifies the number of days late and associated dollar values for Past-due and Anticipated Customer Order Lateness.
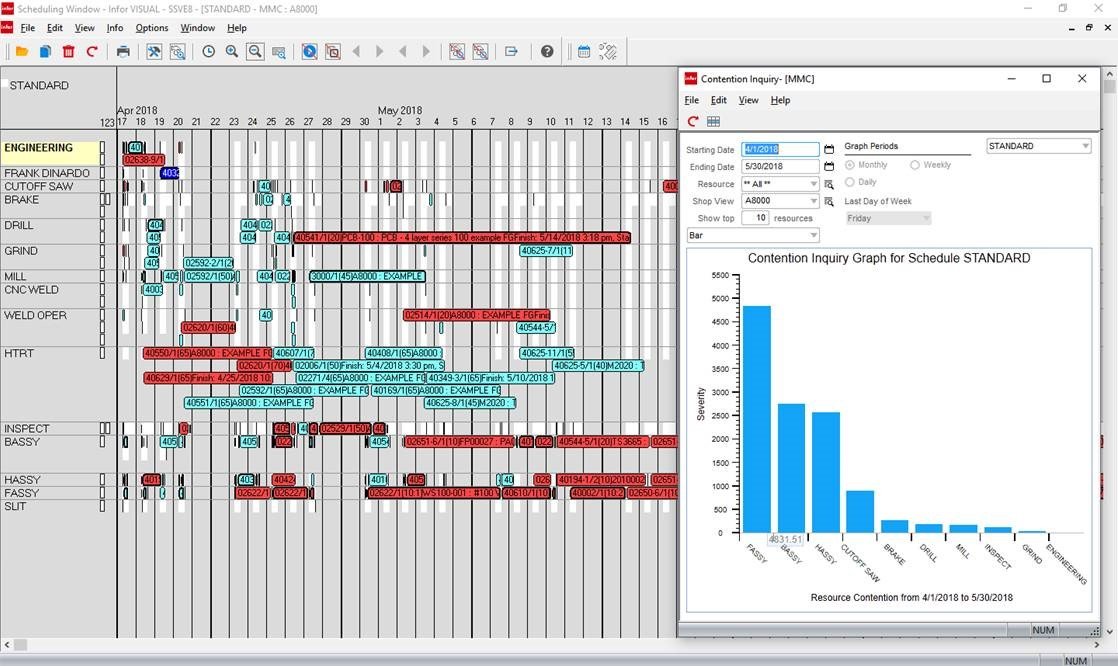
- Contention- Provides a measurable indicator for current and upcoming shop resource bottlenecks by capturing the number of times and associated severity (number of delay days) that the scheduler encountered a scheduling conflict at a particular shop resource.
- Material Constraint- Do you ever wish that you had a Pareto chart showing the top “x” (count of) materials that are causing the greatest scheduling impact? The Material Constraints button provides that. As with all charts in the Throughput Window, you can double-click the particular bar to open up a hyperlinked grid which gives you all of the details (Part ID, Work Order ID, Severity, etc..) to dig in deeper.
- Actual and Expected Throughput- This tool quantifies the business’ actual and expected throughput values. Throughput is defined as Selling Price – Raw Materials-Purchased Parts- Service costs. This is a great place to validate your overall schedule against weekly or monthly production targets. “What-If” schedules can be created to simulate the throughput impact of adding capacity to a bottleneck resource. Does the increased capacity add more to the company’s bottom line or just create a downstream bottleneck?
The next time you are faced with answering difficult scheduling questions from upper management, open up the Throughput Window, analyze the information, create a simulated schedule and compare the results using the above tools. You will quickly get quantitative measurements that will help validate your assumptions and allow you to manage the routine scheduling challenges with confidence in an efficient manner.
Have questions or require assistance? Please contact us. We are at your service!
